
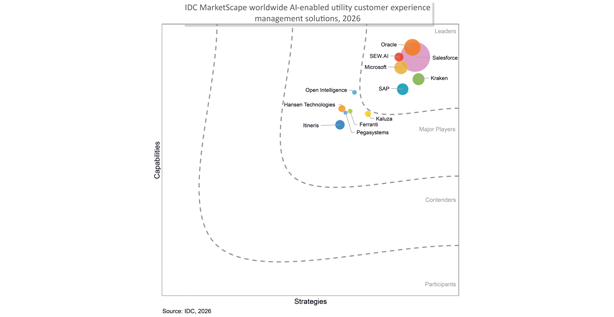
Oracle Named a Leader in IDC MarketScape for AI-Enabled Utility CX Management Solutions
AI-driven customer operations for utilities, improving affordability outcomes, reducing cost-to-serve, and enabling smarter engagement at scale.
Transform Customer Experience into Operational Impact
Utilities are under pressure to do more than improve customer satisfaction, they must manage affordability, reduce cost-to-serve, and support increasingly complex customer journeys.
Oracle helps utilities meet these challenges with a unified, AI-enabled customer platform that connects engagement directly to operational execution.
Unlike fragmented CX approaches, Oracle brings together:
This integrated, closed-loop model, enhanced by Oracle’s Opower behavioral insights, enables utilities to move from reactive service to proactive, data-driven customer operations.
As noted in the IDC MarketScape:
“Ongoing investments in AI and GenAI embedded across the stack position utilities to advance agent augmentation, intelligent automation, and more data-driven customer operations at scale.”
The result:
More effective collections and assistance programs, stronger customer trust, and measurable impact across the entire customer lifecycle.
Oracle helps utilities meet these challenges with a unified, AI-enabled customer platform that connects engagement directly to operational execution.
Unlike fragmented CX approaches, Oracle brings together:
- Customer engagement and service
- Billing and payment workflows
- Hardship and affordability programs
- End-to-end program lifecycle management
This integrated, closed-loop model, enhanced by Oracle’s Opower behavioral insights, enables utilities to move from reactive service to proactive, data-driven customer operations.
As noted in the IDC MarketScape:
“Ongoing investments in AI and GenAI embedded across the stack position utilities to advance agent augmentation, intelligent automation, and more data-driven customer operations at scale.”
The result:
More effective collections and assistance programs, stronger customer trust, and measurable impact across the entire customer lifecycle.
IDC MarketScape vendor analysis model is designed to provide an overview of the competitive fitness of technology and service suppliers in a given market. The research methodology utilizes a rigorous scoring methodology based on both qualitative and quantitative criteria that results in a single graphical illustration of each vendor’s position within a given market. The Capabilities score measures vendor product, go-to-market and business execution in the short-term. The Strategy score measures alignment of vendor strategies with customer requirements in a 3-5-year timeframe. Vendor market share is represented by the size of the circles. Vendor year-over-year growth rate relative to the given market is indicated by a plus, neutral or minus next to the vendor name.